Why study startups?
Successful startups can create more jobs and wealth in the economy and innovate their industries. However, failed startups waste time, money, and oppurunity costs for everyone involved. Finding the traits of successful startups can help future entrepreneurs and investors by focusing their efforts on certain characteristics.

Research question
For my college senior thesis paper, I wanted to look at the reasons for a startup’s success or failure.
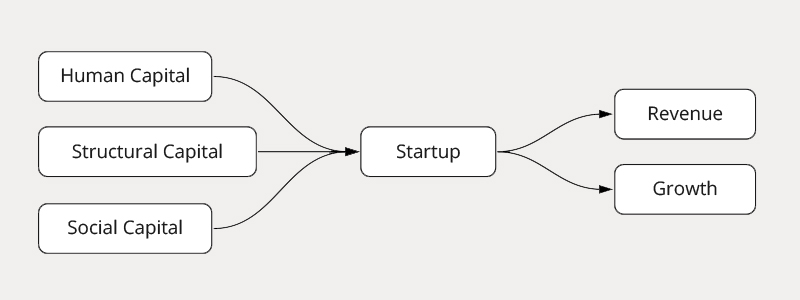
To make a startup measurable, these characteristics can be broken into inputs and outputs.
Previous Literature
Human Capital
Human capital is a variable that accounts for a startup’s team. Statyon and Mangematin (2016) found that a team’s composition is important to success. Andrew Romans (2013) found that most successful startups consisted of a team of a visionary, a technologist, and a salesperson.
Social Capital
Social Capital is defined as the connections, relationships, allances, and investor network a startup has. Xiao and Zhao (2012) found that social capital is often a bottleneck for startups compared to large organizations.
Structural Capital
Previous startup research has studied Structural Capital which is how an organization scales internally with people and their products. Xiao and Zhao (2012) found that an organization’s decision-making should focus on innovation and organizational emergence. Statyon and Mangematin (2016) found that computer and software companies set self-constructed ambitious timelines to create successful products
Methodology
This research paper uses two economic models: Data Envelopment Analysis (DEA) and Boston Consulting Group (BCG) Matrix Analysis.
Data Envelopment Analysis
Data Envelopment Analysis (DEA) creates an efficient frontier for all startups based on their input compared to their output. This creates relative efficiency scores for all the startups in the sample.

Boston Consulting Group Matrix
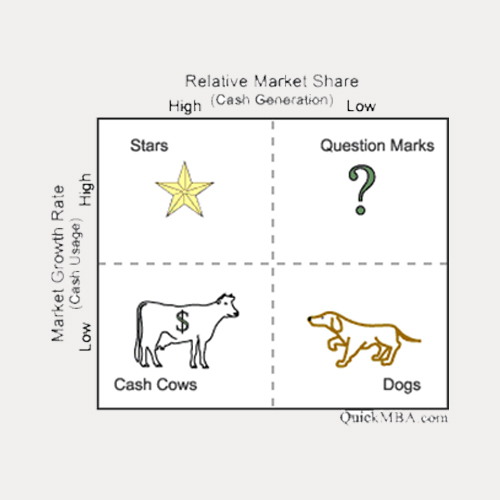
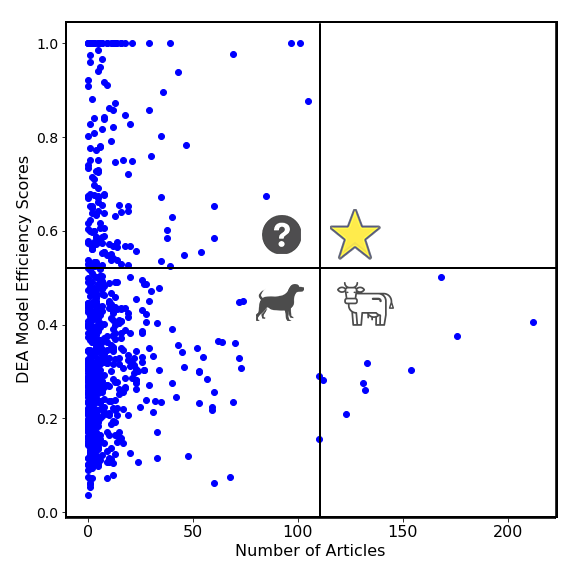
The orginal Boston Consulting Group (BCG) Matrix compares a companies relative market share and their market growth rate to categorize a company’s performance. This paper will use a modified BCG Matrix to compare startup’s relative efficiency score to other characteristics.
Data
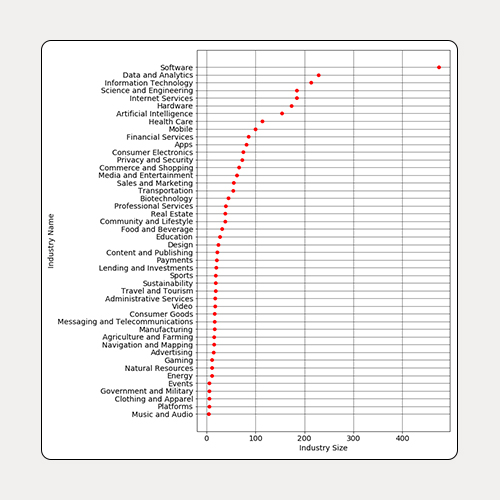
For this study, 757 startups were selected in the San Fransisco Bay Area and the Silicon Valley that were between 3-5 years old in May 2019 and had recieved at least one investment.
Sources
The majority of the information collected for the startups is provided by Crunchbase.com, Owler.com, SimilarWeb.com, and LinkedIn.com. These websites provided the most up-to-date and accurate information for startups.
Process
Check for outliers using Stata
Use DEAP to create efficiency scores
Use Data Handling and Visualization with Python
Results
The results show that most startups are inefficienct compared to only a few peers.
Successful startups scale their structural capital and human capital the quickest.
Focusing on human capital
The highest performing startups quickly scale their human capital by increasing their number of employees. The top 10 most efficienct startups’ average number of employees is 122 employees compared the sample average of 28 employees.
Achieved product market fit
The most efficient startups have achieved a product-market fit through their high outputs such as monthly website hits and estimated revenue. Comparing the average between a startup on the efficient frontier and the average of the top 10 least efficient startups, there is a noticeable difference in monthly website hits of 1.4 million vs 14 thousand and estimated revenue 17 million vs 700 thousand.
Industry advantages
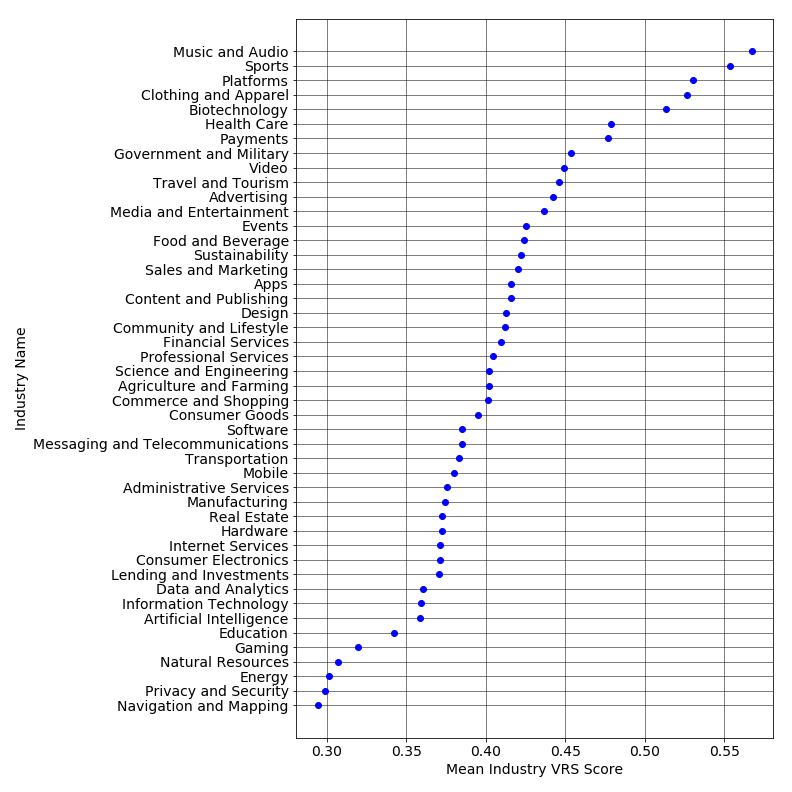
Some industries have a natural advantage for efficiency having shorter product timelines. This allows startups to be more competitive and go through funding rounds quicker. The top 5 industries had an average efficiency score over 50% while the top 5 lowest industries never past 32%.
Takeaways
Starting a company is challenging. Entrepreneurs and Investors need to learn how these efficient startups differentiated themselves to stay competitive.
For Entrepreneurs
Entrepreneurs of startups should focus on achieving a product market fit first then scaling their human capital as quickly as possible. To scale human capital efficiently, entrepreneurs should create a strong organizational process first and then increase the number of employees to an optimal amount based on the current funding and product demand. If a product market fit is not found and a startup is not scaling in five years, then it is best to pull your resources out of the market to limit wasted resources.
For Investors